OptionsVision
Take a screenshot from Robinhood and watch it become an interactive P&L chart. Model different scenarios by adjusting your days to expiration and your implied volatility. Then analyze your Greeks and break-evens, all privately on your device.
Demo Videos
OptionsVision turns any options trade into an interactive payoff chart so you can trade smarter.
Brokerages like Robinhood only show you the payoff at expiration. What's missing is how to value your position before expiration and how to determine whether the option is cheap or expensive. OptionsVision solves these problems in a simple, easy to use UI.
Wondering what your covered call actually looks like if the stock drops 5% with 3 days to expiration remaining? Where your calendar spread breaks even with a change in volatility? Your theta decay if you sold your option right after ex-dividend date? OptionsVision answers these questions with an interactive and accessible payoff chart.
How It Works: Screenshot to Interactive Chart in Seconds
Demo Walkthrough
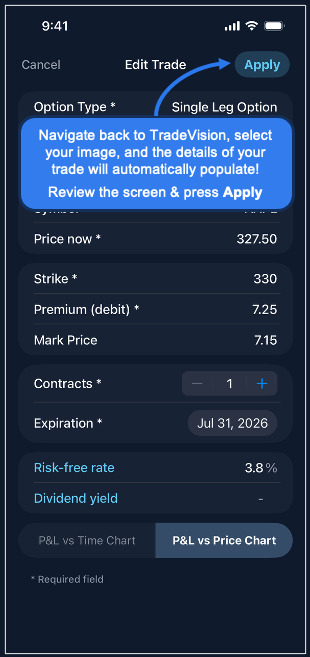
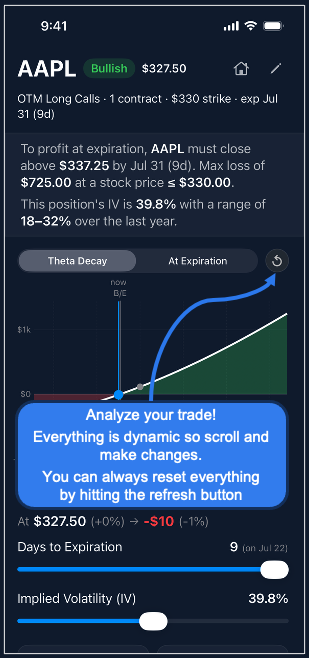
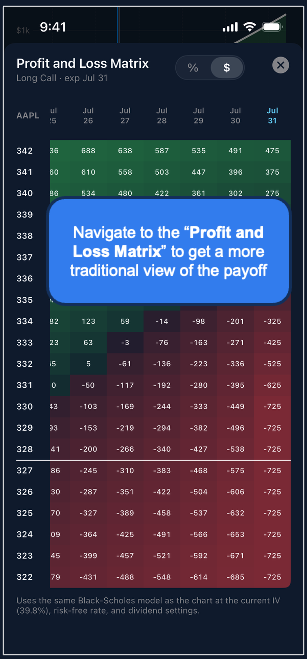
Import in Seconds
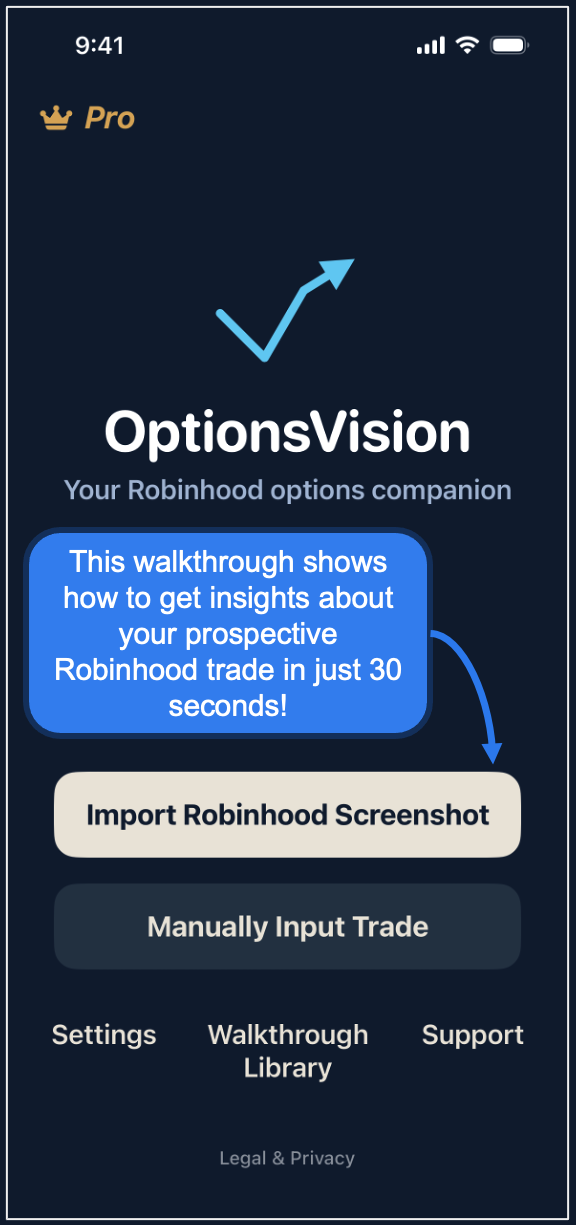
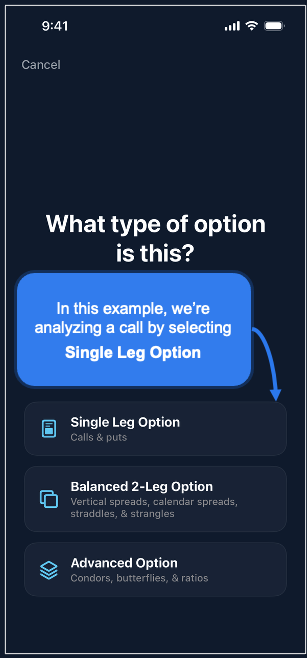
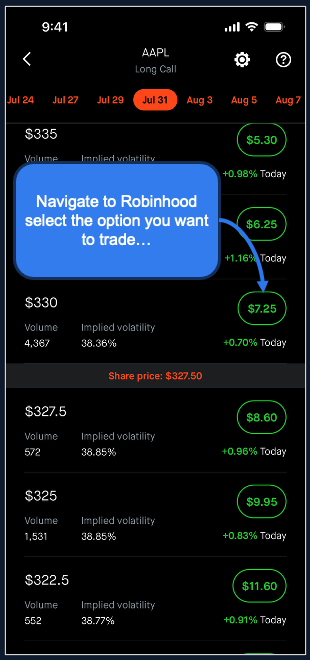
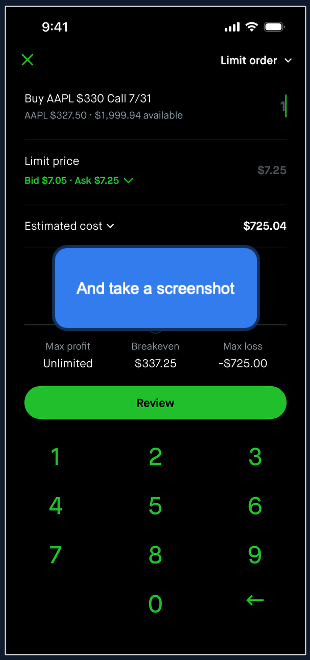
Take a screenshot of your Robinhood order ticket and OptionsVision reads it with Apple's on-device text recognition and automatically pre-populates the strategy, strikes, expiration, spot price, and premiums. Multi-leg trades import from two screenshots (order ticket + per-leg premium) to capture real per-leg IVs as well as multiple expiration dates for calendar spreads. Prefer to skip the screenshot? Enter any trade by hand in a few taps.
See the Whole Trade
An interactive profit-and-loss chart shows your position across the full price range: break-evens marked on the curve, max profit and max loss, and distance-to-break-even at a glance. Scrub any price to see your exact expected P&L.
Watch Time and Volatility Work
Adjust days-to-expiration and IV to watch theta decay reshape your position in real time. Or flip to the at-expiration view for the standard payoff chart. As each dividend's ex-date passes, it drops out of the pricing, so the chart stays accurate.
Real Analytics, Not Approximations
- Black-Scholes pricing with implied volatility solved from your actual per-leg entry premiums
- Live Greeks: Delta, Gamma, Theta, and Vega, per share and for the whole position
- Risk-free rates matched to your expiration from the daily U.S. Treasury yield curve
- Upcoming earnings dates and projected ex-dividends for over 5,000 optionable tickers, refreshed weekly
- Override any assumption including rate, dividend yield, IV
Supports 28 Options Strategies
OptionsVision is built to handle each option strategy with context-aware inputs and a clear explanation of how the trade makes and loses money. Supported strategies include:
- Single Leg Options: Long calls, long puts, covered calls, and cash-secured puts
- 2-Leg Vertical Spreads: Call debit spreads, call credit spreads, put debit spreads, and put credit spreads
- Long Straddles and Long Strangles
- Calendar Spreads: Long call calendar spreads, long put calendar spreads, and short put calendar spreads
- 4-Leg Condors: Long call condor, short call condor, long put condor, short put condor, long iron condor, and short iron condor
- 4-Leg Butterflies: Long call butterfly, short call butterfly, long put butterfly, short put butterfly, long iron butterfly, and short iron butterfly
- Unbalanced Ratios: Put front ratio, call back ratio, and put back ratio
Private by Design
No account necessary and no ads. Your screenshots are processed entirely on your device, and your trades never leave it. The app works completely offline with tickers, earnings, IV history, and dividend data refreshing in the background each week.
Built for Learning
Sharpen how you read a trade and grow the number of options strategies you can confidently use.
OptionsVision is an educational tool and is not investment advice, not a broker, and never touches your brokerage account. Figures are theoretical model estimates, not live quotes. Options involve substantial risk and are not suitable for every investor.